When the wicked rise, men hide themselves: But when they perish, the righteous increase.
Proverbs 28:28
Elements layout
Supposing you are reading a news article on your favorite news website. Invoke the Elements panes by pressing Ctrl + Shift + I or right click and select “Inspect”. You can inspect and debug CSS Grid and Flexbox elements with these tools. You can check the checkboxes before the grid overlays to see them highlighted at the page window. You can set the overlay display settings:
- Show track sizes – show the sizes grid blocks.
- Show area names – show the names.
- Extend grid lines – render the grid further.
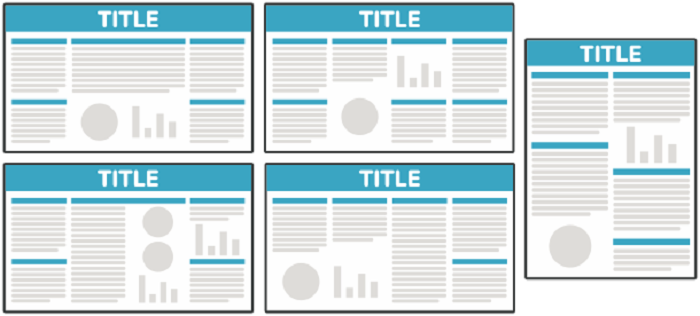
This feature is extremely convenient for understanding where each block on the screen is displayed. See the example page with all layouts.

Popular news website home page with the location and size of each block through the grid

Grid and Flexbox overlays
Deeper into layouts
While reading the article, it is possible that the elements are automatically rearranged after some time (dynamic layout) and the specific content is lost somewhere down, for example. This behavior is called layout shifting. It also may happens when images and advertising elements finish loading. You can investigate this layout shifting with more advanced tools. Inside the Developer tools press Ctrl + Shift + P to invoke the Command menu and type “Rendering”, and run the Show Rendering command. This action will give a rich set of features for diagnosing the webpage behavior.

Example webpage showing rendering regions
The Layout Shift Regions
Paint flashing – highlights areas of the page (green) that need to be repainted. May not be suitable for people prone to photosensitive epilepsy.
Layout Shift Regions – highlight areas of the page (blue) that were shifted. May not be suitable for people prone to photosensitive epilepsy.
Layer borders – shows layer borders (orange/olive) and tiles (cyan).
Frame Rendering Stats – plots frame throughput, dropped frames distribution, and GPU memory usage.

GPU frame rendering statistics view
Scrolling performance issues – highlight elements (teal) that can slowdown scrolling, including touch & wheel event handlers and other main-thread scrolling situations.
Highlight ad frames – highlights frames (red) detected to be ads.
Core Web Vitals – shows an overlay with Core Web Vitals.

Core Web Vitals view
Core local fonts – disables local() sources in @font-face rules. Requires a page reload to apply.
Emulate a focused page – emulates a focused page.
Enable automatic dark mode – enables automatic dark mode and sets prefers-color-scheme to dark. I highly recommend this feature to be enabled when investigating a page.
The web browser’s built-in layout rendering and statistics tools are very useful and convenient when examining the structure and behavior of a web page. Recommended for every web designer and programmer.
Comments